
RangeTrue
AI Lab Report Analysis Platform
AI веб-додаток для пацієнтів, які не розуміють складні лабораторні звіти — PDF → біомаркери → оптимальні діапазони → root-cause guidance.
rangetrue.comProject overview
The problem we solved
Lab PDFs bury patients in tables, units, and reference ranges written for clinicians. RangeTrue turns an uploaded report into a scored biomarker view and plain-language root-cause guidance — so people can see what is optimal, suboptimal, or outside range, and what to discuss with a doctor.
The challenge
What teams were stuck with
Patients received dense lab PDFs with little explanation of how values relate to optimal health — not just the lab’s standard reference interval.
- Lab reports are hard to parse: mixed panels, specialty formats, units, and reference ranges
- Patients could not tell optimal vs. merely “in lab range” without clinical literacy
- No clear prioritization of which biomarkers need attention first
- Generic web search after labs created anxiety without structured, cited guidance
- Processing PDFs at scale required async workers, not a synchronous request path
Our solution
What we built
RangeTrue is an end-to-end AI lab analysis product: encrypted PDF upload, queue-based extraction, biomarker normalization and optimal-range scoring, then Claude-written root-cause guidance with confidence and next steps.
- PDF upload with encrypted storage and a visible multi-step analysis pipeline
- Biomarker extraction from standard panels and specialty lab formats
- Scoring against optimal ranges — not only lab reference intervals
- Root-cause guidance via Anthropic Claude, grounded for clinician discussion
- Async architecture on AWS Lambda, SQS, S3, and Aurora PostgreSQL
- Infrastructure as code with Terraform for repeatable deploys
Technology
Built with enterprise-grade technology
Goals and objectives
What the platform needed to deliver
01
Make lab PDFs understandable
Extract values, units, and ranges automatically so patients see structured biomarkers instead of raw tables.
02
Score against optimal ranges
Flag optimal, suboptimal, and outside-standard results on a clear health score scale.
03
Explain root causes carefully
Generate lifestyle and discussion guidance with confidence notes — not a diagnosis.
04
Process reports asynchronously
Queue extraction and scoring so 3–5 minute analyses stay reliable as user volume grows.
05
Keep health data secure
Encrypted file storage and no plaintext logging of lab PDFs in the product flow.
06
Scale the platform
Ship a production stack ready for 1,000+ users with managed AWS and Aurora PostgreSQL.
Solution in action
See the platform in action
From PDF upload to root-cause guidance — how RangeTrue turns lab reports into clarity.
01
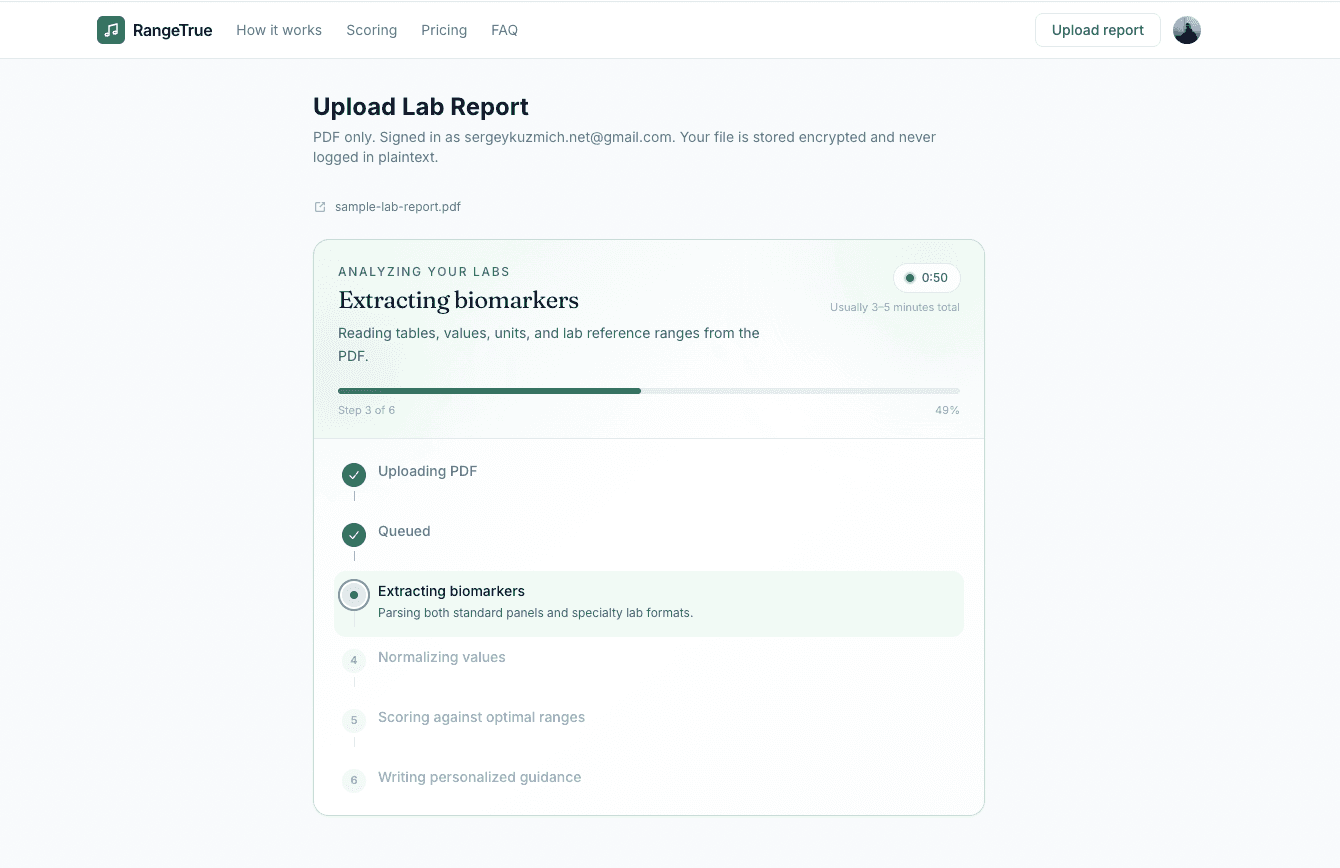
Upload & analyzing labs
Patients upload a lab PDF. The UI tracks a six-step pipeline — upload, queue, extract biomarkers, normalize, score against optimal ranges, then write personalized guidance.
02
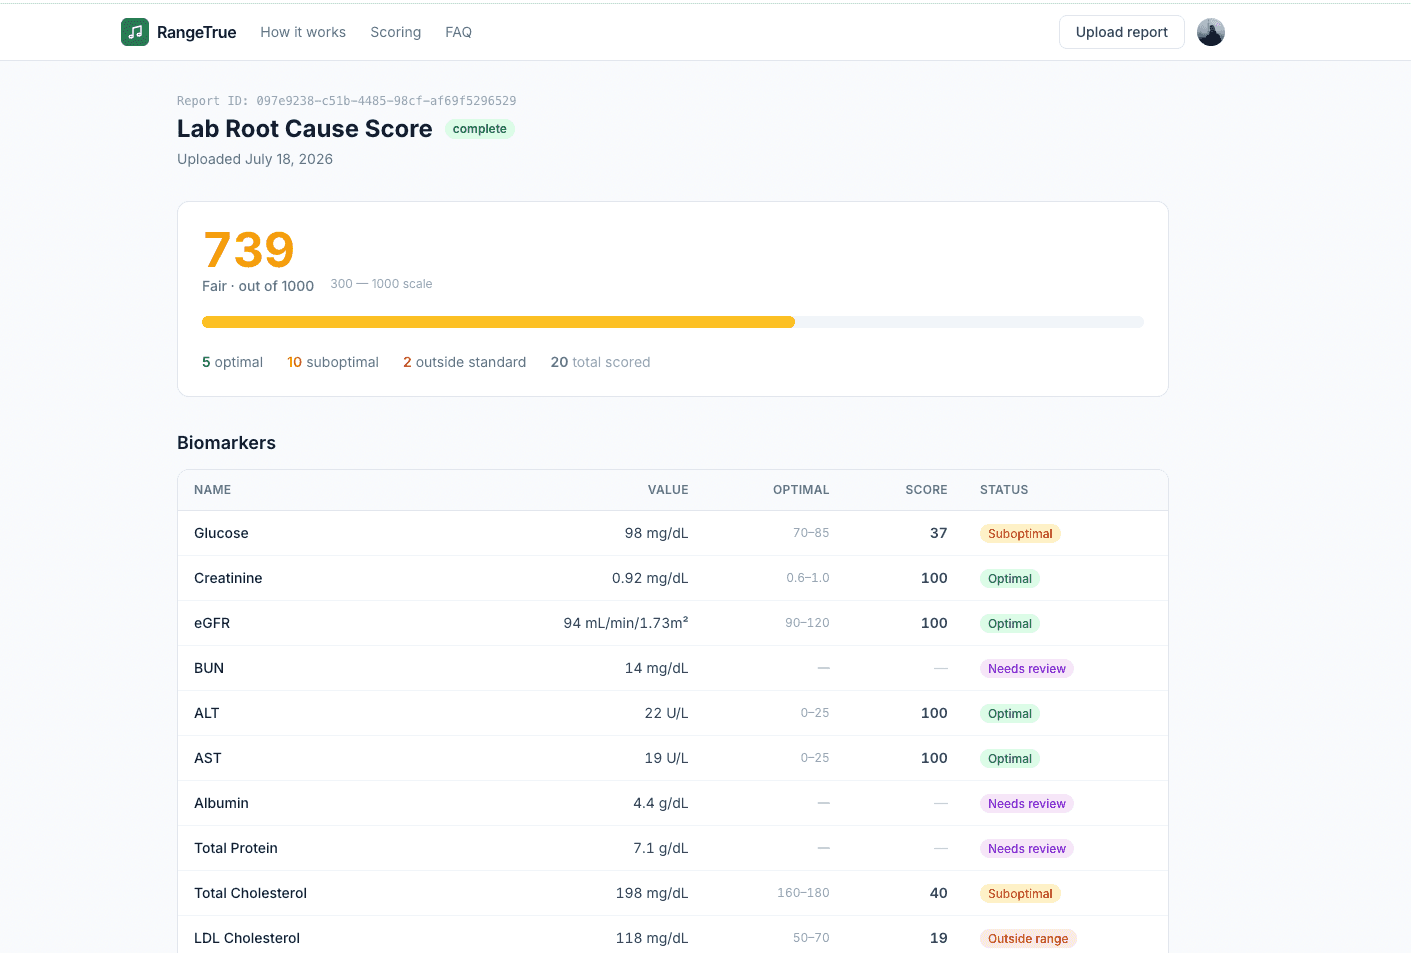
Lab root cause score
A completed report shows an overall score on a 300–1000 scale, plus counts of optimal, suboptimal, and outside-standard biomarkers in a sortable table.
03
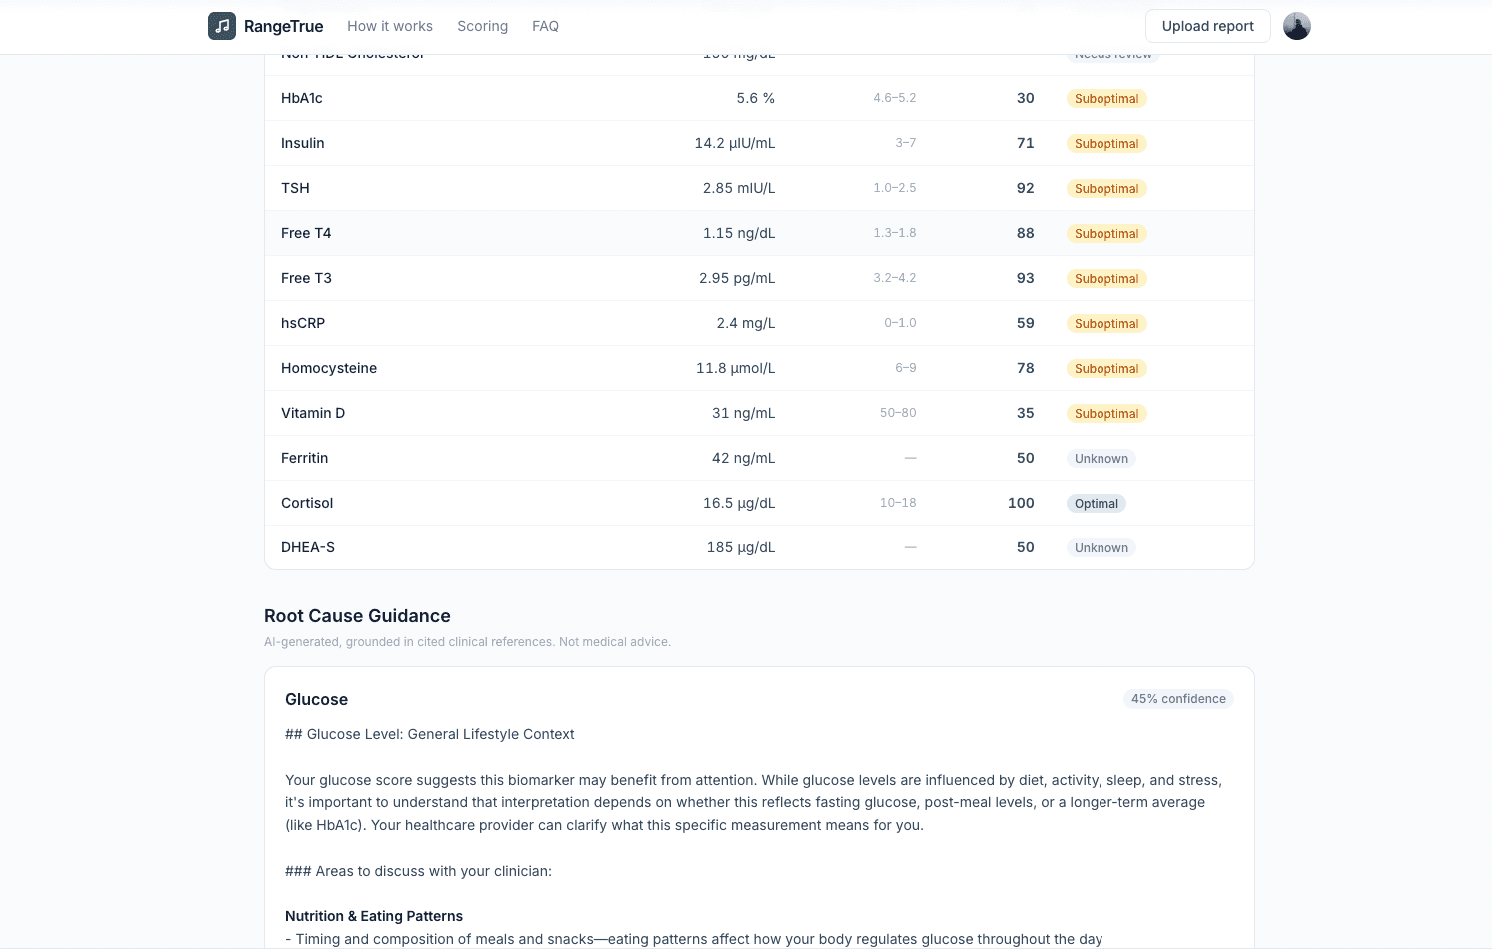
Biomarkers & root-cause guidance
Extended panels (HbA1c, hormones, inflammation markers, and more) sit above Claude-generated guidance for markers that need attention — with confidence and clinician-discussion framing.
04
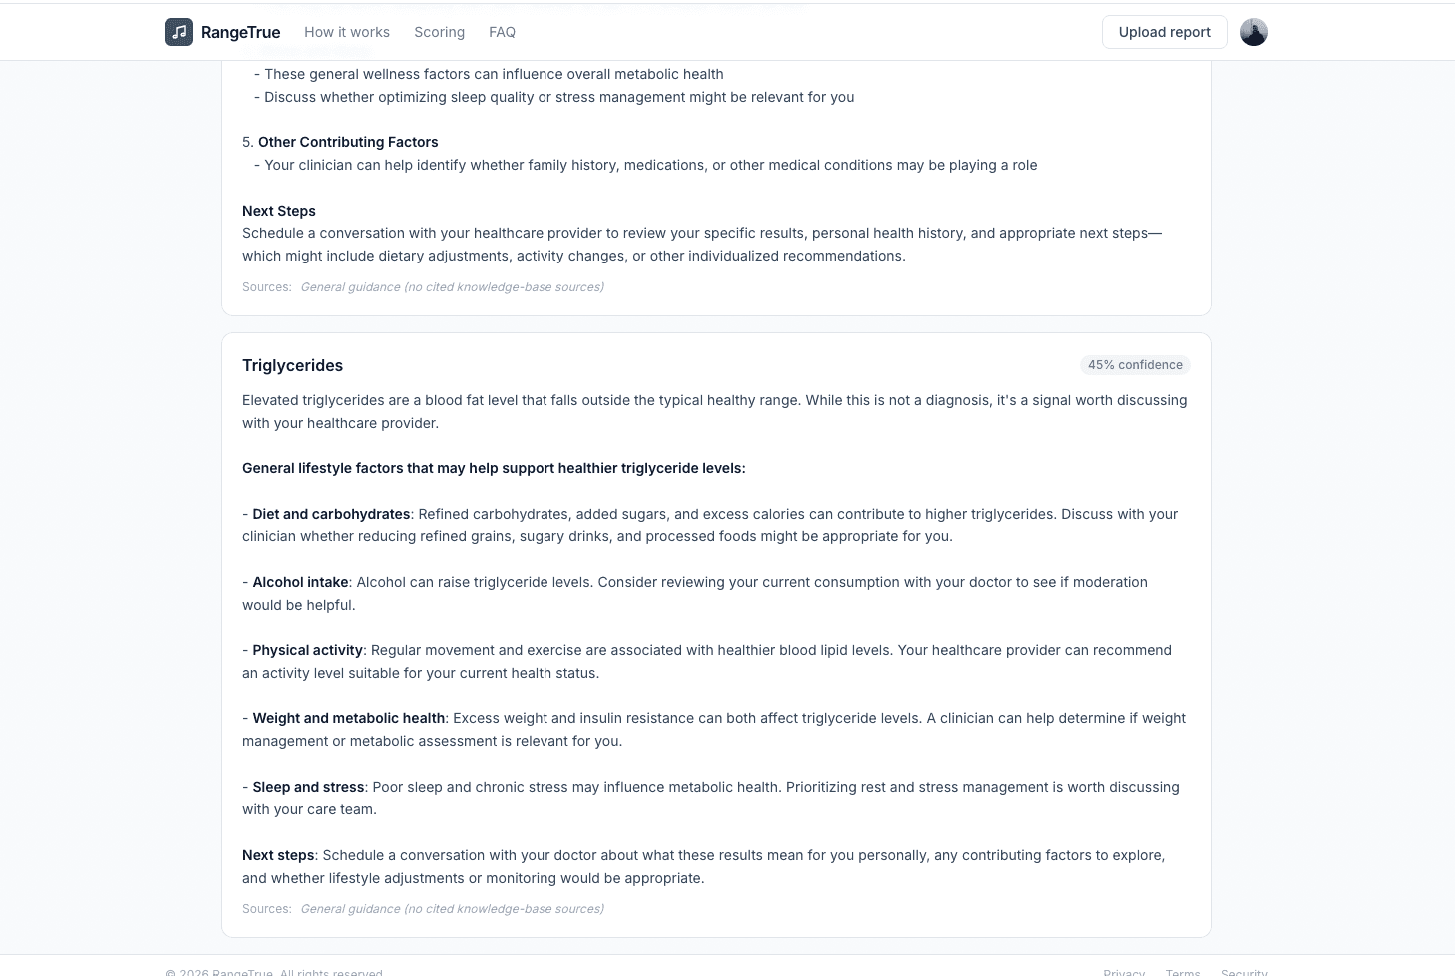
Deep biomarker guidance
Per-marker cards explain what the result may mean and lifestyle factors to discuss with a doctor — diet, activity, sleep, and stress — with transparent source notes.
Platform architecture
How it all works together
1
Next.js product UI
Upload, progress tracking, scored biomarker tables, and guidance views for authenticated patients.
2
Python / FastAPI analysis service
Backend APIs and workers that parse PDFs, normalize units, and score biomarkers against optimal ranges.
3
SQS + Lambda async pipeline
Lab jobs enqueue after upload; Lambdas run extraction and scoring without blocking the request path.
4
S3 encrypted PDF storage
Reports stored encrypted in S3 — product copy states files are never logged in plaintext.
5
Aurora PostgreSQL
Users, report metadata, biomarker results, and guidance artifacts persist in Aurora PostgreSQL.
6
Anthropic Claude + Terraform
Claude writes root-cause guidance; Terraform defines the AWS footprint for repeatable environments.
Results
Value and impact delivered
What changed once the platform was live.
Scaled to 1,000+ users
Production platform grew past a thousand users on the async AWS architecture.
Lab PDFs become scored clarity
Patients see optimal-range scoring and status pills instead of opaque tables alone.
Root-cause guidance, not raw data dumps
Claude-generated cards prioritize what to discuss with a clinician — with confidence and caveats.
Pipeline built for volume
Queue-based PDF processing keeps multi-minute analyses reliable as upload volume increases.